The three websites I checked out were:
I started by getting a free account for each. Afterwards I started browsing around and watching some tutorials to make sure I wasn't overlooking any features of either website. After that and having the research I wanted to use on hand, it was time to create.
Easel.ly

If you have used Prezi before then I feel like Easel.ly should be fairly easy to use. I personally find Prezi a tiny bit tedious for me so after tinkering with it for a bit I gave it a pass.
Piktochart

Personally I felt like Piktochart had the easiest ready-made templates to use. It took a bit of time to get the hang of it but after a while it felt like using a more modern version of Microsoft Publisher. I felt comfortable using it and ended up using this one for my final product.
Infogr.am
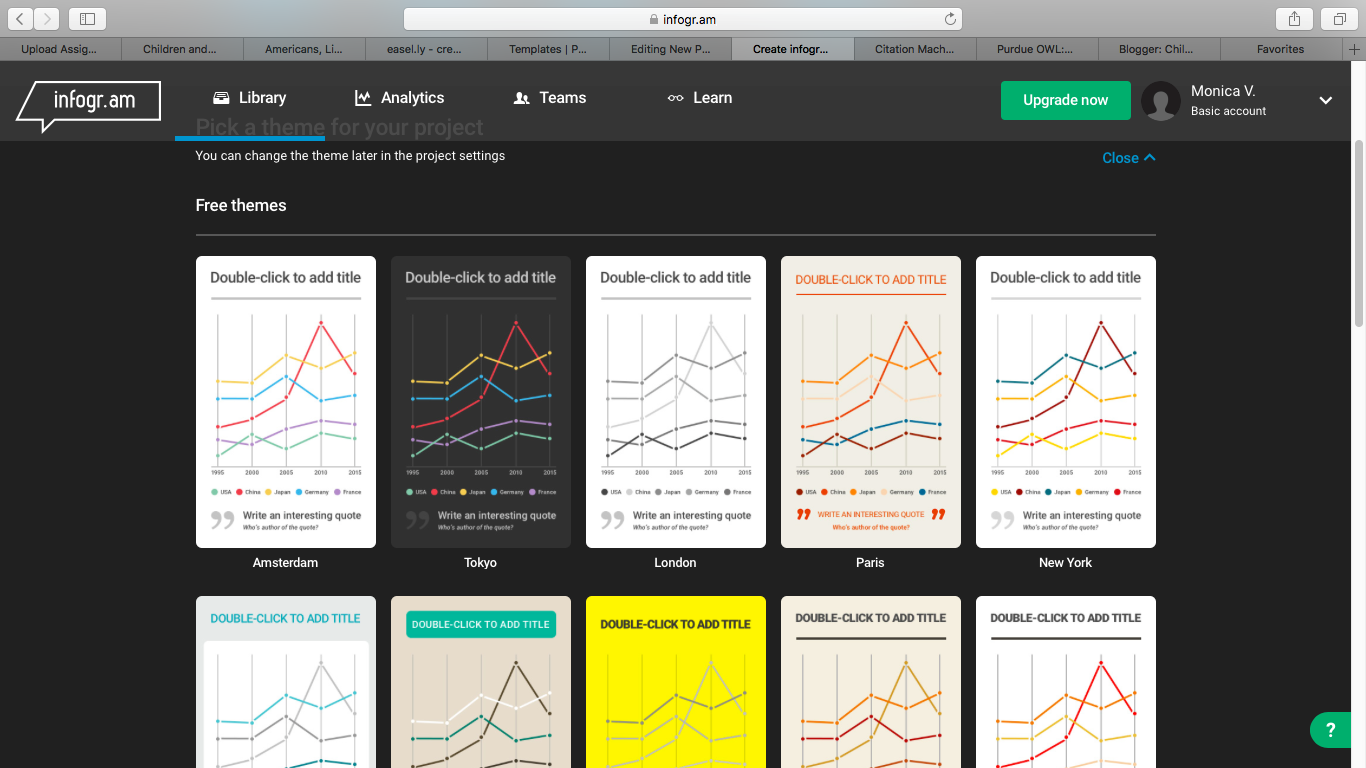
I was left completely confused with this one. I kept going back to see if maybe I was choosing the wrong option but I wasn't. Based on the templates it was offering me it felt more like a way to create chart and that's it. Not much room for anything else other than that. I quit after a few attempts.
Final product!
Infographic Using Piktochart
I used research based on the services public libraries offer and how well they are used by the general public. Citations are on the infographic.
Let me know which site you used to create your own infographic. If you have any tips to better use the other sites I mentioned please comment below.
-Monica V.
I also felt like Prezi was very similar to Ease.ly. I enjoyed making the infographic, but it did take me a long time. And you? Did it take you a long time as well?
ReplyDeleteI felt the same way about all three. Piktochart seems to be the most popular and easiest the easiest to use. Great knowing I wasn't the only one who thought Easle.ly was a bit complicated. Great job!
ReplyDeleteinfogr.am's basic presentation of information was quite a let down, huh? the template page with all the charts was not visually appealing nor did it entice me to want to create an infographic.
ReplyDelete